Continuous Duty Command-Line
In this post, I'll enumerate, elaborate, and demonstrate features of command-line utilities that might come in handy while operating in an industrial setting such as the datacenter, cloud, or serverless.
What, When, Where, ... #
Often times we think of command-line utilities in terms of stop-gap solutions; just a quick script to tide us over. Almost as often, we'll wind up automating its periodic or event-triggered invocation, or at least write up some documentation so that others can share in the early morning fun :)
Ahh, am I blurring the line here? After all a service can be run from the command-line? True, but in this post I mean to discuss applications expected to start, do stuff, then stop; and "batch" has had, like, zero cachet for a few decades, lol.
Whatever the path or terminology, once the application becomes part of the process, we'll soon find that features typical for services are also very helpful in this situation. Many revolve around logging, a subject near and dear to my heart, so let's jump in there!
Log, log, log #
The importance of logging from a command-line application becomes apparent as soon as we think of running in the context of operating an infrastructure or service in production, particularly at scale. When did the "thing" last run? How did it go? Why did it fail? And so on/forth.
Structured #
The logs emitted shall be structured. Oops, I've gotten on my high horse, but honestly ...
High-horses aside, this generally means a string for a field name, and something useful for a value. Only taking it one layer deep usually works well. Logging a json object as an escaped string value can be a good choice for example.
Oh!, and of course we'll try our very best to (re)use field names consistently.
A tidy example of a structured log message:
{
  "app_id": "load-ztb",
  "count": 46641,
  "level": "info",
  "msg": "inserting records",
  "run_id": "WyDBEeB",
  "ts": "2023-12-03T17:18:19.817878596Z"
}
At its most basic it's made up of:
- timestamp: nanoseconds are overkill, milliseconds are just barely not enough precision
- level: "info" and "error" at the least (maybe totally adequate?)
- message: think of filtering here and put variables in their own fields
Startup and Shutdown #
Startup is a good time to log:
- configuration
- application version
{
  "app_id": "load-ztb",
  "config": "{\"version\":\"main.31.c774032\",\"logger\":{\"max_len\":999},\"http_client\":{\"base_uri\":\"https://localhost:9200\",\"timeout\":60000000000,\"timeout_short\":10000000000,\"skip_verify\":true,\"user\":\"elastic\",\"pass\":\"--redacted--\"},\"es\":{\"es_index\":\"ztbus003a\"},\"ztb_svc\":{\"chunk_size\":999,\"dry_run\":false},\"data_path\":\"/home/trimble/ztbus/compressed/B183_2022-09-21_04-21-57_2022-09-21_17-19-17.csv\"}",
  "level": "info",
  "msg": "starting up",
  "run_id": "WyDBEeB",
  "ts": "2023-12-03T17:18:19.749230325Z"
}
Shutdown lets us know the process exited cleanly:
{
  "app_id": "load-ztb",
  "level": "info",
  "msg": "shutting down",
  "run_id": "WyDBEeB",
  "ts": "2023-12-03T17:18:21.998939321Z"
}
Context #
Which is to say(ask), in what situation was the log message emitted? What other messages are relevant to it? Sample context fields might include:
app_idapplication emitting the log messagerun_idper invocationrequest_idper request to an external servicecustomer_idall about the customer yeah?- etc, etc
Here's a screen-cap of Kibana showing a request and it's particular response by filtering on request_id:
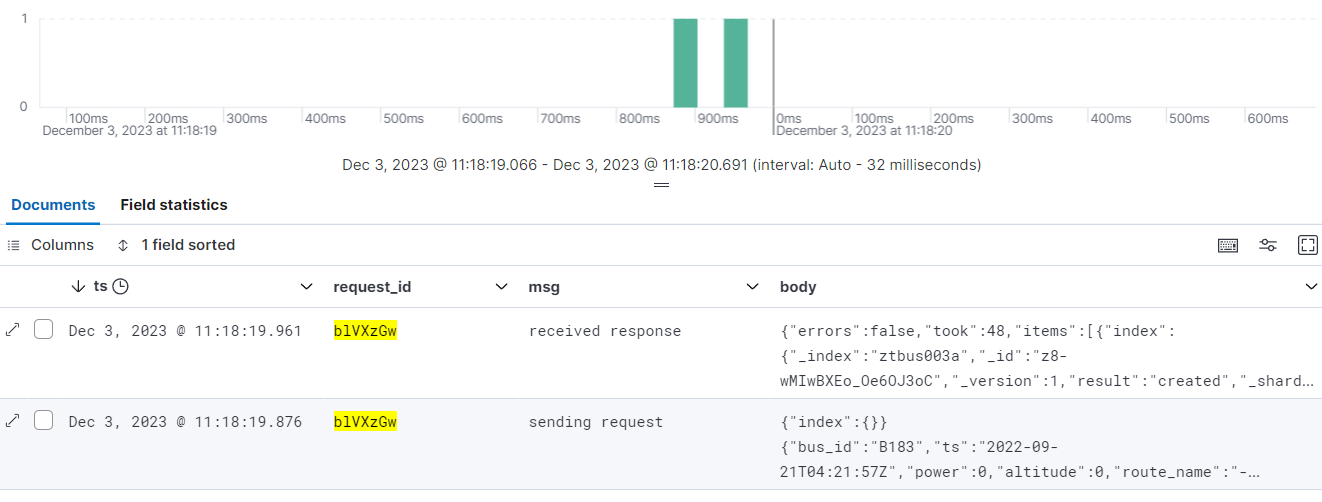
Note that body is nicely unescaped by Kibana; suitable for cut and paste should the need arise :)
Filtering or pivoting on context fields can be a lifesaver when troubleshooting. If multiple applications share field names and logs are centralized, even more power to divine the inscrutable is unlocked.
Request and Response #
Don't underestimate this one when it comes to helping a wayward ticket to find a good home! :)
{
  "app_id": "load-ztb",
  "body": "{\"index\":{}}\n{\"bus_id\":\"B183\",\"ts\":\"2022-09-21T17:07:51Z\",\"power\":-41344.18,\"altitude\":0.8272433,\"route_name\":\"-\",\"passenger_count\":0,\"vehicle_speed\":8.666659,\"traction_force\":-5627.946}\n{\"index\":{}}\n{\"bus_id\":\"B183\",\"ts\":\"2022-09-21T17:07:52Z\",\"power\":-114116.7,\"altitude\":0.827243,\"route_name\":\"-\",\"passenger_count\":0,\"vehicle_speed\":8.705517,\"traction_force\":-14219.29}\n{\"index\":{}}\n{\"bus_id\":\"B183\",\"ts\":\"2022-09-21T17:07:53Z\",\"power\":-149650.6,\"altitude\":0.8272427,\"route_name\":\"-\",\"passenger_count\":0,\"vehicle_speed\":8.369486,\"traction_force\":-19760.97}\n{\"index\":{}}\n{\"bus_id\":\"B183\",\"ts\":\"2022-09-21T17:07:54Z\",\"power\":-135849.4,\"altitude\":0.8272418,\"route_name\":\"-\",\"passenger_count\":0,\"vehicle_speed\":8.039319,\"traction_force\":-18266.29}\n{\"index\":{}}\n{\"bus_id\":\"B183\",\"ts\":\"2022-09-21T17:07:55Z\",\"power\":-81624.16,\"altitude\":0.8272413,\"route_name\":\"-\",\"passenger_count\":0,\"vehicle_speed\":7.842234,\"traction_force\":-12093.6}\n{\"index\":{}}\n{\"bus_id\":\"B183\",\"ts\":\"2022-09-21T17:07:--truncated--",
  "headers": "{\"Accept\":[\"application/json\"],\"Authorization\":[\"--redacted--\"],\"Content-Type\":[\"application/json\"]}",
  "host": "localhost:9200",
  "level": "info",
  "method": "POST",
  "msg": "sending request",
  "path": "/ztbus003a/_bulk",
  "query": "{}",
  "request_id": "gYw4iMp",
  "run_id": "WyDBEeB",
  "scheme": "https",
  "ts": "2023-12-03T17:18:21.970821934Z"
}
Truncation #
Of course when you start logging request and response bodies, things can get out of hand quickly. Simply truncating log values is an easy way to keep the lid on (as seen just above in the request log message).
Logging of the request and response bodies is without doubt the most extravagant of the features shown off today. If API interactions are running smoothly, we can turn off logging of the body:
~/proj/ztbus$ ZTB_SVC_DRYRUN=false ZTB_CLIENT_SKIPBODY=true bin/aggregate{
"app_id": "agg-ztb",
"headers": "{\"Accept\":[\"application/json\"],\"Authorization\":[\"--redacted--\"],\"Content-Type\":[\"application/json\"]}",
"host": "localhost:9200",
"level": "info",
"method": "GET",
"msg": "sending request",
"path": "/ztbus003a/_search",
"query": "{}",
"request_id": "fb9M5jr",
"run_id": "q5ZohJs",
"scheme": "https",
"ts": "2023-12-05T18:24:55.185363534Z"
}
{
"app_id": "agg-ztb",
"elapsed": 21407478,
"headers": "{\"Content-Type\":[\"application/json\"],\"X-Elastic-Product\":[\"Elasticsearch\"]}",
"level": "info",
"msg": "received response",
"path": "/ztbus003a/_search",
"request_id": "fb9M5jr",
"run_id": "q5ZohJs",
"status": 200,
"ts": "2023-12-05T18:24:55.206763937Z"
}Elapsed #
Explicitly logging an elapsed time can save a step later on as compared to calculating a duration from messages timestamps.
An example showing how long it took to get a response from Elasticsearch:
{
  "app_id": "load-ztb",
  "body": "{\"errors\":false,\"took\":16,\"items\":[{\"index\":{\"_index\":\"ztbus003a\",\"_id\":\"UdCwMIwBXEo_Oe6OLy4Y\",\"_version\":1,\"result\":\"created\",\"_shards\":{\"total\":2,\"successful\":1,\"failed\":0},\"_seq_no\":92595,\"_primary_term\":1,\"status\":201}},{\"index\":{\"_index\":\"ztbus003a\",\"_id\":\"UtCwMIwBXEo_Oe6OLy4Y\",\"_version\":1,\"result\":\"created\",\"_shards\":{\"total\":2,\"successful\":1,\"failed\":0},\"_seq_no\":92596,\"_primary_term\":1,\"status\":201}},{\"index\":{\"_index\":\"ztbus003a\",\"_id\":\"U9CwMIwBXEo_Oe6OLy4Y\",\"_version\":1,\"result\":\"created\",\"_shards\":{\"total\":2,\"successful\":1,\"failed\":0},\"_seq_no\":92597,\"_primary_term\":1,\"status\":201}},{\"index\":{\"_index\":\"ztbus003a\",\"_id\":\"VNCwMIwBXEo_Oe6OLy4Y\",\"_version\":1,\"result\":\"created\",\"_shards\":{\"total\":2,\"successful\":1,\"failed\":0},\"_seq_no\":92598,\"_primary_term\":1,\"status\":201}},{\"index\":{\"_index\":\"ztbus003a\",\"_id\":\"VdCwMIwBXEo_Oe6OLy4Y\",\"_version\":1,\"result\":\"created\",\"_shards\":{\"total\":2,\"successful\":1,\"failed\":0},\"_seq_no\":92599,\"_primary_term\":1,\"status\":201}},{\"inde--truncated--",
  "elapsed": 26596677,
  "headers": "{\"Content-Length\":[\"129879\"],\"Content-Type\":[\"application/json\"],\"X-Elastic-Product\":[\"Elasticsearch\"]}",
  "level": "info",
  "msg": "received response",
  "path": "/ztbus003a/_bulk",
  "request_id": "gYw4iMp",
  "run_id": "WyDBEeB",
  "status": 200,
  "ts": "2023-12-03T17:18:21.997319155Z"
}
Some units on elapsed might be nice, n'est-ce pas?
In any case, it doesn't take much imagination to see how relevant elapsed could be when running arbitrary aggregations against a sprawling ES cluster.
Errors (never! : ) #
These will be of some interest.
Ideally, errors should be actionable. Imagine a view into the logs showing stuff you want/need to deal with, like today or this week.
Top-level errors may be trickier to log, particularly when failing to start up or crashing, but we'll be glad to have them in the logs when possible:
{
  "app_id": "load-ztb",
  "error": "open bargle/data.csv: no such file or directory\nfailed to open: bargle/data.csv\nztbus.New\n\t/home/trimble/proj/ztbus/ztbus.go:117\nmain.main\n\t/home/trimble/proj/ztbus/cmd/load-ztbus/main.go:58\nruntime.main\n\t/home/trimble/go1211/src/runtime/proc.go:267\nruntime.goexit\n\t/home/trimble/go1211/src/runtime/asm_amd64.s:1650",
  "level": "error",
  "msg": "fatal top-level error",
  "run_id": "kSGQNDV",
  "ts": "2023-12-03T18:10:27.54724148Z"
}
Notice the stack trace smooshed into the error string; another big time-saver! Would be nice for the trace to go into its own field though, yeah?
Redaction #
Logging of secrets (for example, a password or token), is officially not a good idea. Redacting them from logs, and any other output, is good in that you can see they are present, but without disclosing the secret itself.
Search for "-redacted-" on this page to see some examples. Conversely "5BW" (shhhhh!) is nowhere to be found. Easy now, it's a small fragment of a big password for an inaccessible throw-away dev server; should be ok? :)
Transport #
Segueing from what to log .. ; a quick note on how.
In the era of containerization, we can leave transport to the infrastructure and simply emit logs to stdout or stderr. Only when this really won't work should we think of adding the complexity of logging to the network from within the application.
Another benefit is the way this approach pushes us to deploy utilities to prod. Should things go horribly awry, it's better to have left a tidy change management trail.
Configuration #
Via the Environment #
This works well in an industrial setting generally and no less so for a command-line application. See my post Encapsulated Environmental Configuration and/or The Twelve-Factor App's page for more detail.
Environmental configuration can be a tiny bit awkward or unfamiliar when invoking manually, but quite workable nonetheless.
Here I show:
- loading a configuration into the environment
- overriding dry-run while asking for a config-dump via flag
- and the resulting sanity-check output
~/proj/ztbus$ . etc/ztb-secret.sh
~/proj/ztbus$ ZTB_SVC_DRYRUN=false bin/load-ztbus -c
{
"version": "main.31.c774032",
"logger": {
"max_len": 999
},
"http_client": {
"base_uri": "https://localhost:9200",
"skip_verify": true,
"user": "elastic",
"pass": "--redacted--"
},
"es": {
"es_index": "ztbus003a"
},
"ztb_svc": {
"chunk_size": 999,
"dry_run": false
},
"data_path": "compressed/B183_2022-09-21_04-21-57_2022-09-21_17-19-17.csv"
}Sweet!, the json here is quite readable compared to an equivalent amount of config as flags and arguments.
Hey, what's with the "-c" flag?; that's cheating! Maybe a little, but once the actual config is relegated to the environment we can think of a flag or two as meta-config?
Usage #
A little help from the application can go a long way:
~/proj/ztbus$ ZTB_SVC_DRYRUN=false bin/load-ztbus -h'load-ztbus' parses a given ztbus csv and inserts the records to ES
The following environment variables are available for configuration:
KEY TYPE DEFAULT REQUIRED DESCRIPTION
ZTB_LOGGER_MAXLEN Integer maximum length that will be logged for any field
ZTB_CLIENT_BASEURI String true ex: http://llp.org:4080/graphql
ZTB_CLIENT_TIMEOUT Duration 1m request timeout
ZTB_CLIENT_TIMEOUTSHORT Duration 10s dialer and header timeout
ZTB_CLIENT_SKIPVERIFY True or False skip cert verification
ZTB_CLIENT_USER String username for basic auth
ZTB_CLIENT_PASS Redact password for basic auth
ZTB_ELASTIC_IDX String true es index name
ZTB_SVC_CHUNK Integer 999 number of records per chunk to insert
ZTB_SVC_DRYRUN True or False stop short of hitting repo
ZTB_DATAPATH String true path of ztbus data file for inputOne could include a small novel, or a link to the wiki, but the star here is the table of configurables. A good operator can intuit most of what they need to know from this, and, as it's generated from the code is almost certainly up-to-date :) The table is also a handy source for all the correctly spelled variable names with a quick copy/paste.
Version #
How do we get the tidy version string seen above anyway? The magic of make!:
EXECS   := $(wildcard cmd/*)
TARGETS := ${EXECS:cmd/%=%}

BRANCH   := ${shell git branch --show-current}
REVCNT   := ${shell git rev-list --count $(BRANCH)}
REVHASH  := ${shell git log -1 --format="%h"}

LDFLAGS  := -X main.version=${BRANCH}.${REVCNT}.${REVHASH}

### other actions ommitted for clarity

build: ${TARGETS}
        @echo ":: Done"

${TARGETS}:
        @echo ":: Building $@"
        go build -ldflags '${LDFLAGS}' -o bin/$@ cmd/$@/main.go
BRANCH and REVCOUNT are nice to have.
REVHASH is all you really need to find the code that exhibited such shocking behavior.
LDFLAGS is, of course, Golang specific where main.version is kind of cool in that it will set var version string in any and all main packages built thusly.
Rubber Meet Road #
Dry-Run #
The idea with a dry-run is to get as close as possible to making the change, logging all the things, and yet stopping short.
At some point the big clean-up project, or similar, will go live in prod and it's quite comforting to perform a dry-run just prior to taking the plunge.
~/proj/ztbus$ bin/load-ztbus 2>&1 | jq -s .[]...
{
"app_id": "load-ztb",
"count": 46641,
"level": "info",
"msg": "inserting records",
"run_id": "ImtV1UA",
"ts": "2023-12-04T18:12:53.401069163Z"
}
{
"app_id": "load-ztb",
"dry_run": "true",
"level": "info",
"msg": "stopping short",
"run_id": "ImtV1UA",
"ts": "2023-12-04T18:12:53.458551526Z"
}
...Here we see load-ztb finding 46641 records and then stopping short just before it would have begun chucking them into ES.
Throttle #
A throttle is very much in the spirit of dry-run, but on the other side of the divide. The idea with throttle is to perform some small portion of the changes and pause for feedback and monitoring before proceeding.
I don't have an example to show off for this one because the ztbus project lacks a rather important characteristic.
It's insert behavior is not idempotent.
Which is to say that if I run the loader twice, we'll have two copies of each record in ES, not good.
If however, we had a unique id for each record, ES can see this as an upsert or we could skip. In which case we could easily run load on subsets without fear of getting things into a snarl.
I'm leaving this section in as a bit of a teaser. Throttling is cool for operations and idempotence is a fantastic property enabling it and many other simplifications.
Exit Code #
In Unix-like environments, a non-zero value indicates failure. Even if the CLI cannot get an error message logged, a non-zero exit will give the invoking system a chance to do so, and who knows maybe even alert someone.
~/proj/ztbus$ ZTB_DATAPATH=bargle/data.csv bin/load-ztbus
{"app_id":"load-ztb","config":"{\"version\":\"main.32.5c8a51f\",\"logger\":{\"max_len\":999},\"http_client\":{\"base_uri\":\"https://localhost:9200\",\"timeout\":60000000000,\"timeout_short\":10000000000,\"skip_verify\":true,\"user\":\"elastic\",\"pass\":\"--redacted--\"},\"es\":{\"es_index\":\"ztbus003a\"},\"ztb_svc\":{\"chunk_size\":999,\"dry_run\":true},\"data_path\":\"bargle/data.csv\"}","level":"info","msg":"starting up","run_id":"Bb9h8sJ","ts":"2023-12-04T01:00:34.718240848Z"}
{"app_id":"load-ztb","error":"open bargle/data.csv: no such file or directory\nfailed to open: bargle/data.csv\nztbus.New\n\t/home/trimble/proj/ztbus/ztbus.go:117\nmain.main\n\t/home/trimble/proj/ztbus/cmd/load-ztbus/main.go:58\nruntime.main\n\t/home/trimble/go1211/src/runtime/proc.go:267\nruntime.goexit\n\t/home/trimble/go1211/src/runtime/asm_amd64.s:1650","level":"error","msg":"fatal top-level error","run_id":"Bb9h8sJ","ts":"2023-12-04T01:00:34.718612747Z"}
trimble@tartu:~/proj/ztbus$ echo $?
1
Reference #
The examples presented above are from a project demonstrating an approach to Golang Elasticsearch aggregation. Many features are achieved without much (further) effort, thanks to:
The End #
Can you believe it?
The above opinions are my own, and are offered in the spirit of helpfulness and with the hope of provoking thought. Shoot me an email if you'd like to get in touch!
Thanks for reading :)
- Previous: Fluid Simulation
- Next: ConfigState